
FOREX HIGH ACCURACY - SRC INDICATOR MT 4
Replenishment date: 27.04.2024
Manual issue of goods
You may need to contact the seller to receive the item. Carefully read the terms of delivery specified in the product description
You may need to contact the seller to receive the item. Carefully read the terms of delivery specified in the product description
Sales:
0
Refunds:
0
Reviews:
0
Views:
229

Description
SRC INDICATOR MT 4
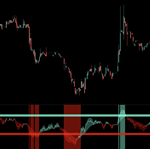
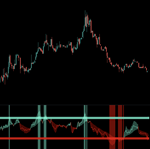
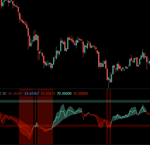
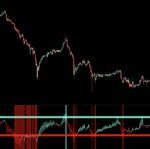
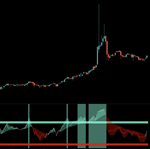
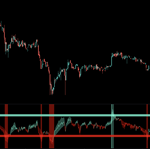
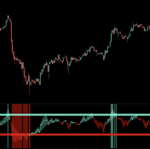
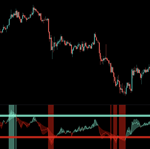
The Relative Strength Index (RSI) momentum indicator used in technical analysis that measures the magnitude of recent price changes to evaluate overbought or oversold conditions in the price of any financial asset. The RSI is displayed as an oscillator (a line chart that moves between two extremes) and can have readings from 0 to 100. The indicator was originally developed by J. Wells Wilder, Jr. and introduced in his seminal 1978 book New Concepts. in technical trading systems. The Smoothie RSI Cloud (SRC) is a hybrid version of the same standard RSI which is a very powerful indicator that has all the features like the standard RSI for example it provides technical information to traders about bullish and bearish price momentum and it is often displayed on chart. in "Existing panel below". An asset is usually considered overbought when the SRC is above 70 and oversold when it is below 30.
A bullish divergence occurs when the SRC makes an oversold reading followed by a higher low corresponding to lower lows in the asset's price. This indicates rising bullish momentum and a break above the oversold zone could be used to trigger a new long position.
A bearish divergence occurs when the SRC creates an overbought reading followed by a lower high that matches the corresponding higher price highs. This indicates a weakness in the trend and increased bearish momentum, which could signal a new short position.
Being an advanced form of the regular RSI, our indicator uses some well-known other calculations such as the weighted moving average (WMA), which determines the trend direction more accurately than the simple moving average (SMA) and assigns equal weights to all numbers in the data set. A smoothed period is also used, which we can also set manually from the settings, and all of them are calculated along with the value to make this wonderful indicator work in action.
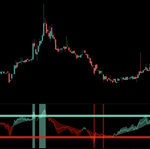
It has beautiful colored clouds that inform market participants about the current market sentiment and momentum. Light blue indicates a strengthening situation or momentum, while light red indicates a bearish trend. They can be used to assess the optimistic or pessimistic state of the market as a whole in this period of time. The SRC lines are leading and they are light blue when the asset's actual price rises and turns light red when the asset's actual price depreciates. A vertical transparent red on the indicator indicates a line crossing above or below the 70 or 75 overbought lines. While blue indicates a line crossing below or above the 30 or 25 oversold level.
Delivery to an email address in all countries of the world within 24 hours.
The Relative Strength Index (RSI) momentum indicator used in technical analysis that measures the magnitude of recent price changes to evaluate overbought or oversold conditions in the price of any financial asset. The RSI is displayed as an oscillator (a line chart that moves between two extremes) and can have readings from 0 to 100. The indicator was originally developed by J. Wells Wilder, Jr. and introduced in his seminal 1978 book New Concepts. in technical trading systems. The Smoothie RSI Cloud (SRC) is a hybrid version of the same standard RSI which is a very powerful indicator that has all the features like the standard RSI for example it provides technical information to traders about bullish and bearish price momentum and it is often displayed on chart. in "Existing panel below". An asset is usually considered overbought when the SRC is above 70 and oversold when it is below 30.
A bullish divergence occurs when the SRC makes an oversold reading followed by a higher low corresponding to lower lows in the asset's price. This indicates rising bullish momentum and a break above the oversold zone could be used to trigger a new long position.
A bearish divergence occurs when the SRC creates an overbought reading followed by a lower high that matches the corresponding higher price highs. This indicates a weakness in the trend and increased bearish momentum, which could signal a new short position.
Being an advanced form of the regular RSI, our indicator uses some well-known other calculations such as the weighted moving average (WMA), which determines the trend direction more accurately than the simple moving average (SMA) and assigns equal weights to all numbers in the data set. A smoothed period is also used, which we can also set manually from the settings, and all of them are calculated along with the value to make this wonderful indicator work in action.
It has beautiful colored clouds that inform market participants about the current market sentiment and momentum. Light blue indicates a strengthening situation or momentum, while light red indicates a bearish trend. They can be used to assess the optimistic or pessimistic state of the market as a whole in this period of time. The SRC lines are leading and they are light blue when the asset's actual price rises and turns light red when the asset's actual price depreciates. A vertical transparent red on the indicator indicates a line crossing above or below the 70 or 75 overbought lines. While blue indicates a line crossing below or above the 30 or 25 oversold level.
Delivery to an email address in all countries of the world within 24 hours.
Additional Information
Money Back Guarantee.If the product does not work, send me a message.
After checking the goods, if everything is confirmed.
I will refund the money within one day.